Visualization of the sensor data
Tuesday, 06. October 2015
Introduction
Based on our research last week and today (see Roberto's entry from today) we decided that we have to visualize the sensor's (gyro z) data. With this LOG-Entry I just want to give a short overview how I implemented the visualization.
The data from the 'Gyro Z' sensor are difficult to understand/analyze without a graphical representation. That's why I created a small data analyzing page today. I didn't want to lose too much time with that, so I used Spring to generate JSON data and Google Charts to represent them as a line graph.
With that tools we can visualize the data quickly and easy. Besides we only need the page for our better understanding.
Raw data first
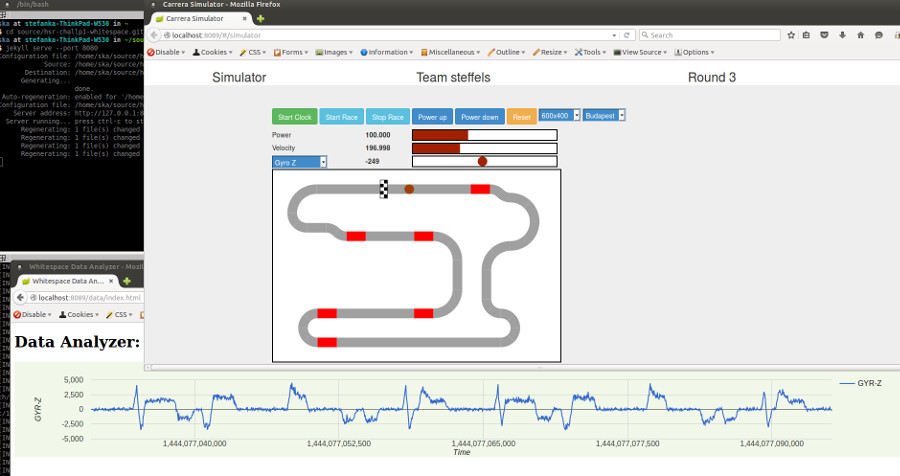
In the first step, I just took the raw data as they come from the SensorEvent's. Under http://localhost:8089/data/index.html I provided a simple page which loads the data periodically from the system. If you start the simulator, the graph automatically refresh's itself:

TODO: At the moment we don't delete old data, so the the payload (JSON) which is transfered from server to the browser gets always bigger. Maybe we should optimize that, if we get problems with the performance in the browser.
Moving averages
Now we like to smooth this function a little, otherwise it will be difficult to work with those values. Out math professor told us something about Moving averages, so we googled a little about that.
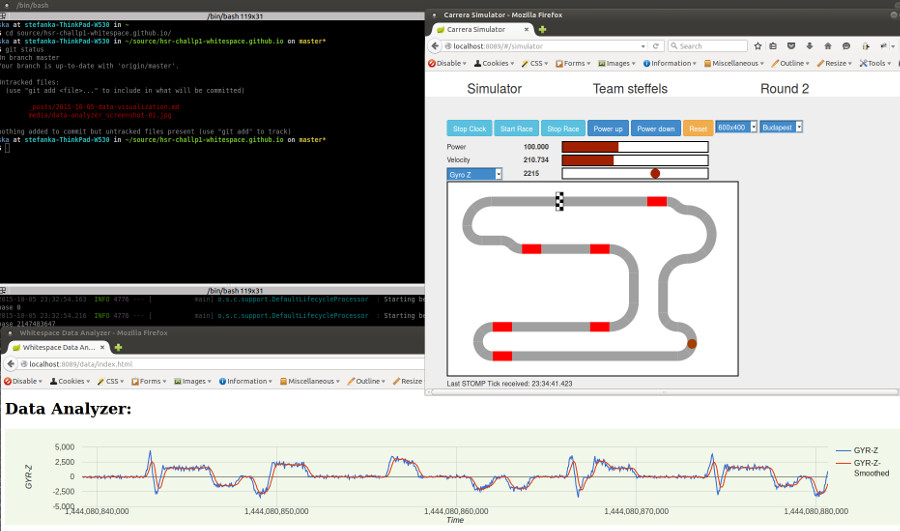
By chance we found the class com.zuehlke.carrera.timeseries.FloatingHistory which was already used in an experimental actor of the starter-kit. We thought that this does exactly what we want to do. I added another function to our graph using this class:
FloatingHistory smoothedValues = new FloatingHistory(8);

// Sensor event:
double gyrZ = event.getG()[2];
smoothedValues.shift(gyrZ);

// get mean:
smoothedValues.currentMean()
The new image:

Next steps
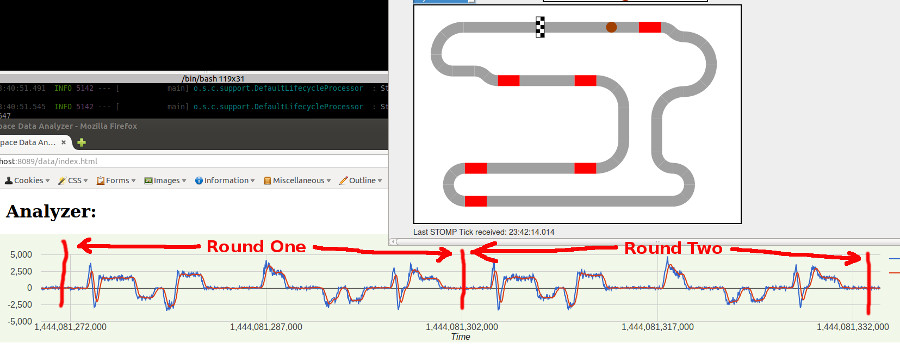
One of the next steps would be, to find out when the track repeats. (period of our signal) With the smoothed data, it should be possible to find repeating parts:

First, we thought, we can use the RoundTimeMessage to find the repetition of the track because at the first barrier we always get this event. But unfortunately this event provides an invalid timestamp :-/ Bug or Feature? :-)
Thats it, for today...